Global Mean Sea Level is the average ocean height, without the waves, currents, and tides. Although it has seemed rather stable for the last six thousand years of human civilization, sea level changes by more than a hundred meters (~330 feet) vertically causing coastlines to move tens of miles rather permanently. Global sea level changes largely due to the size of the ice sheets on land, primarily Antarctica and Greenland, which get smaller in times of global warming, whether naturally caused or as a result of human changes to the atmosphere. Thermal expansion of seawater is a secondary factor. On a regional scale, sea level can increase or decrease due to land subsidence or uplift.

The Pattern in the Geologic Record is Clear
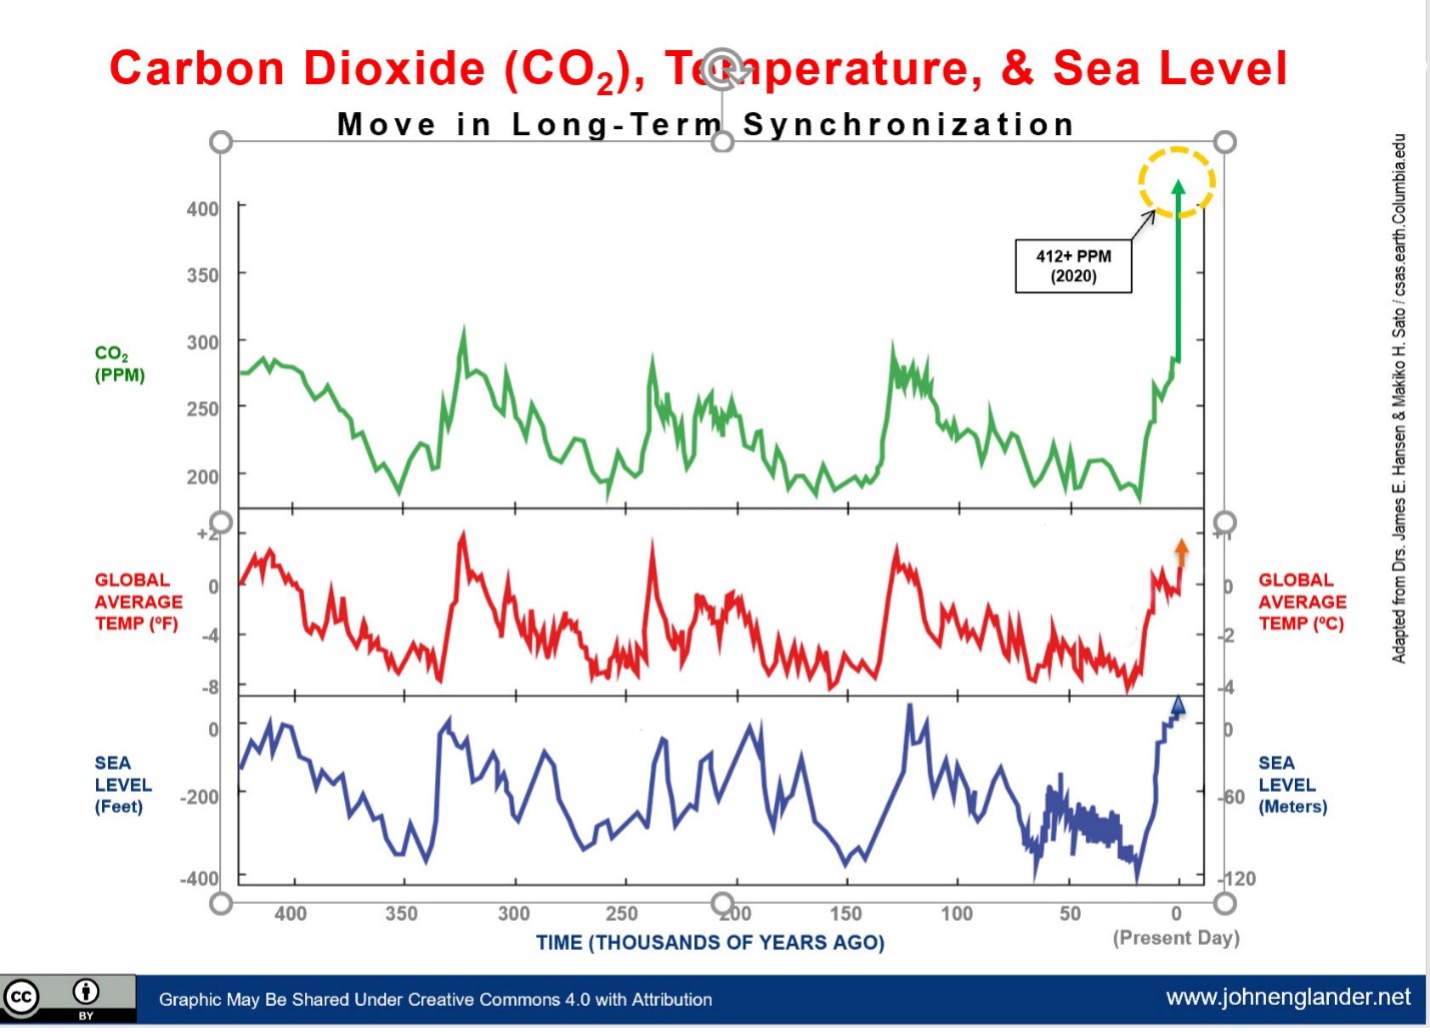
These graphs show carbon dioxide, temperature, and sea level over the last 400,000 years. The top green line is carbon dioxide, the middle red line is temperature, and the bottom blue line is sea level. They illustrate the near-perfect synchronization of the three. Looking at the ratio of sea level to temperature change in these graphs, sea level rises about 20 m per degree C of warming (35 ft per degree F). Over the last 100-150 years, we have already warmed the planet 1.2 degrees C (2.1 degrees F). According to the patterns in the geologic record, that is 20 m (~65 ft) of sea level rise locked in. And we are on track to warm 3- or 4-degrees C.

Sea Level Has Changed Before, and It Is Changing Again
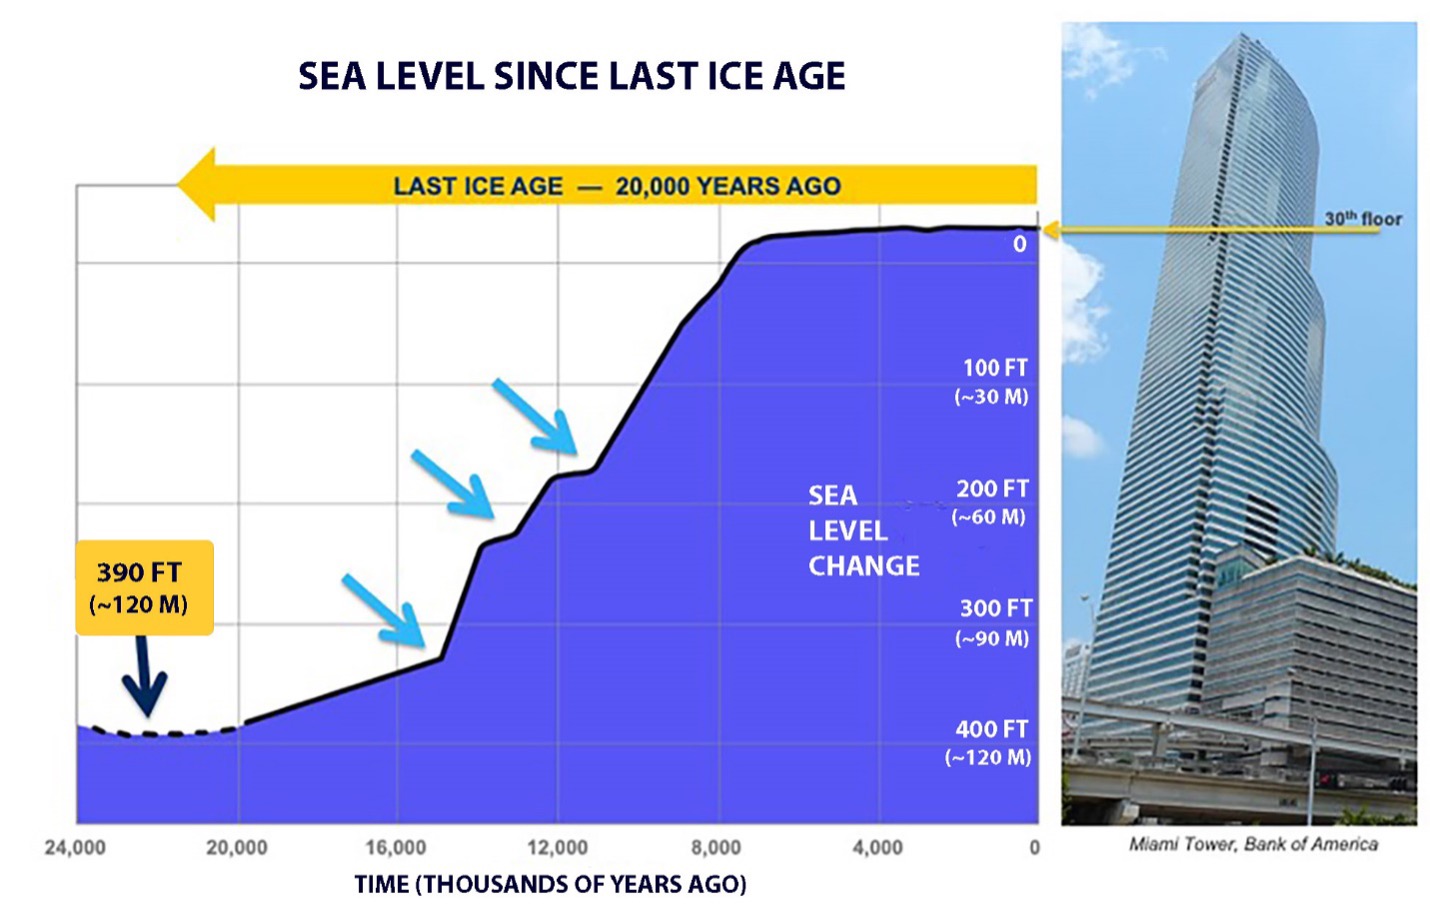
This graph shows sea level change since the peak of the last ice age 20,000 years ago, when the sea level was 390 ft (~120 m) lower than today. The building is the 47-story Bank of America building in Miami. The current height of sea level is equivalent to the 30th floor of the building. Sea level did not rise smoothly, it was not a linear increase. The red arrows point to the areas where the slope changed, indicating there were abrupt changes in the rate of sea level rise. In the coming decades and centuries, sea level will not rise uniformly, there will be periods of abrupt rise when sea level will increase dramatically over relatively short periods.

Florida is a Powerful Example of How Changing Sea Level Can Shift the Shoreline
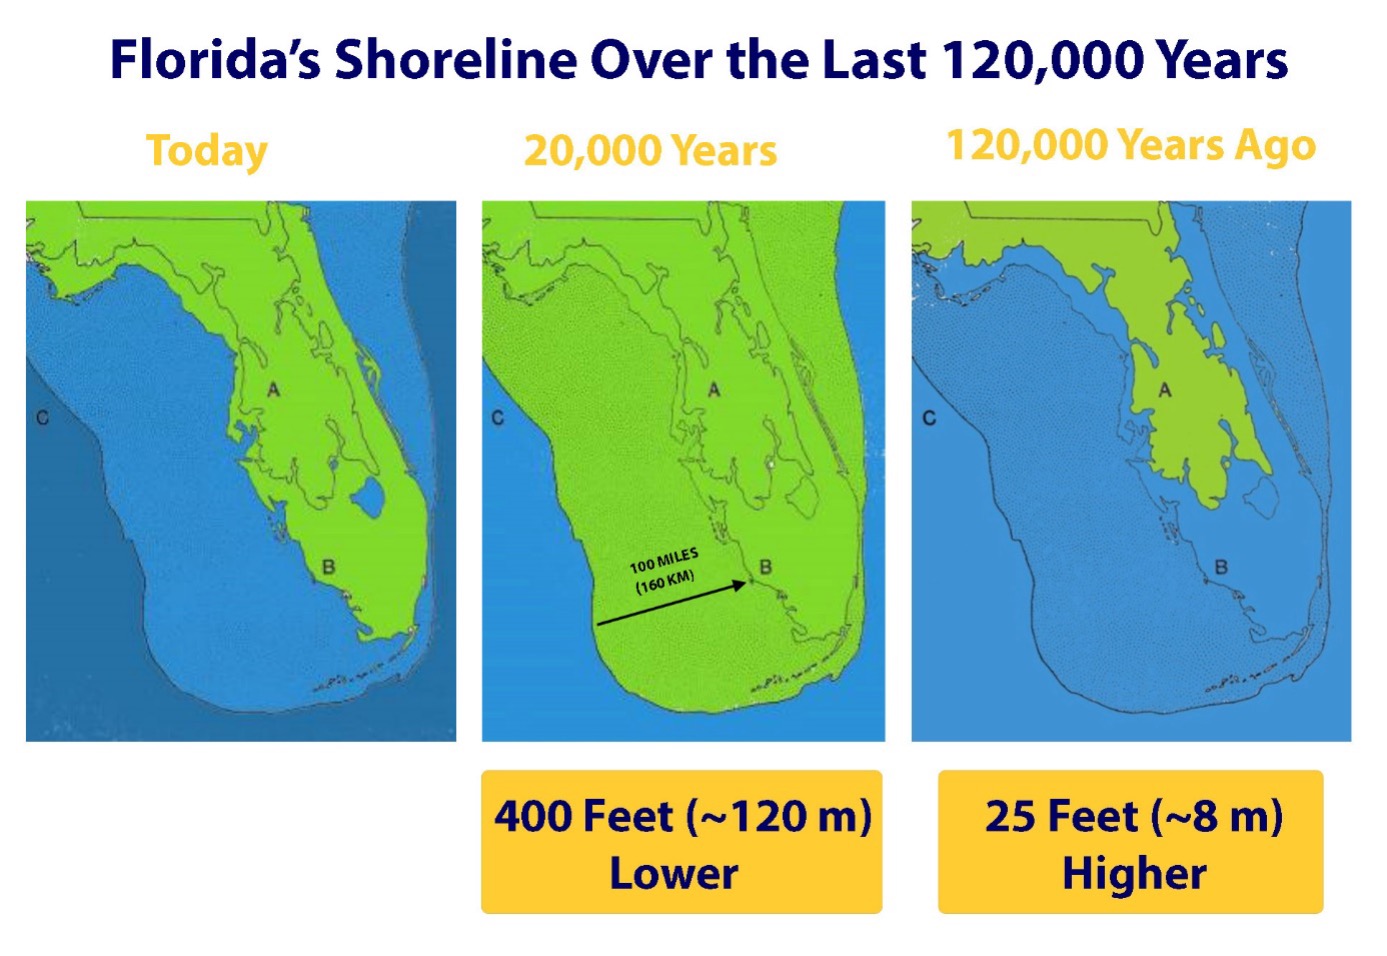
To illustrate how shorelines change with sea level height, here is an image of Florida over the last 120,000 years. Its iconic shape has changed dramatically as sea level moved up and down. The first image is what Florida looks like today. The second image shows Florida 20,000 years ago, when sea level was about 400 ft (~120 m) lower than today. The last image shows Florida 120,000 years ago, when sea level was 25 ft higher (~8 m), and Florida was about half the size.

The Rate of Rise is Accelerating
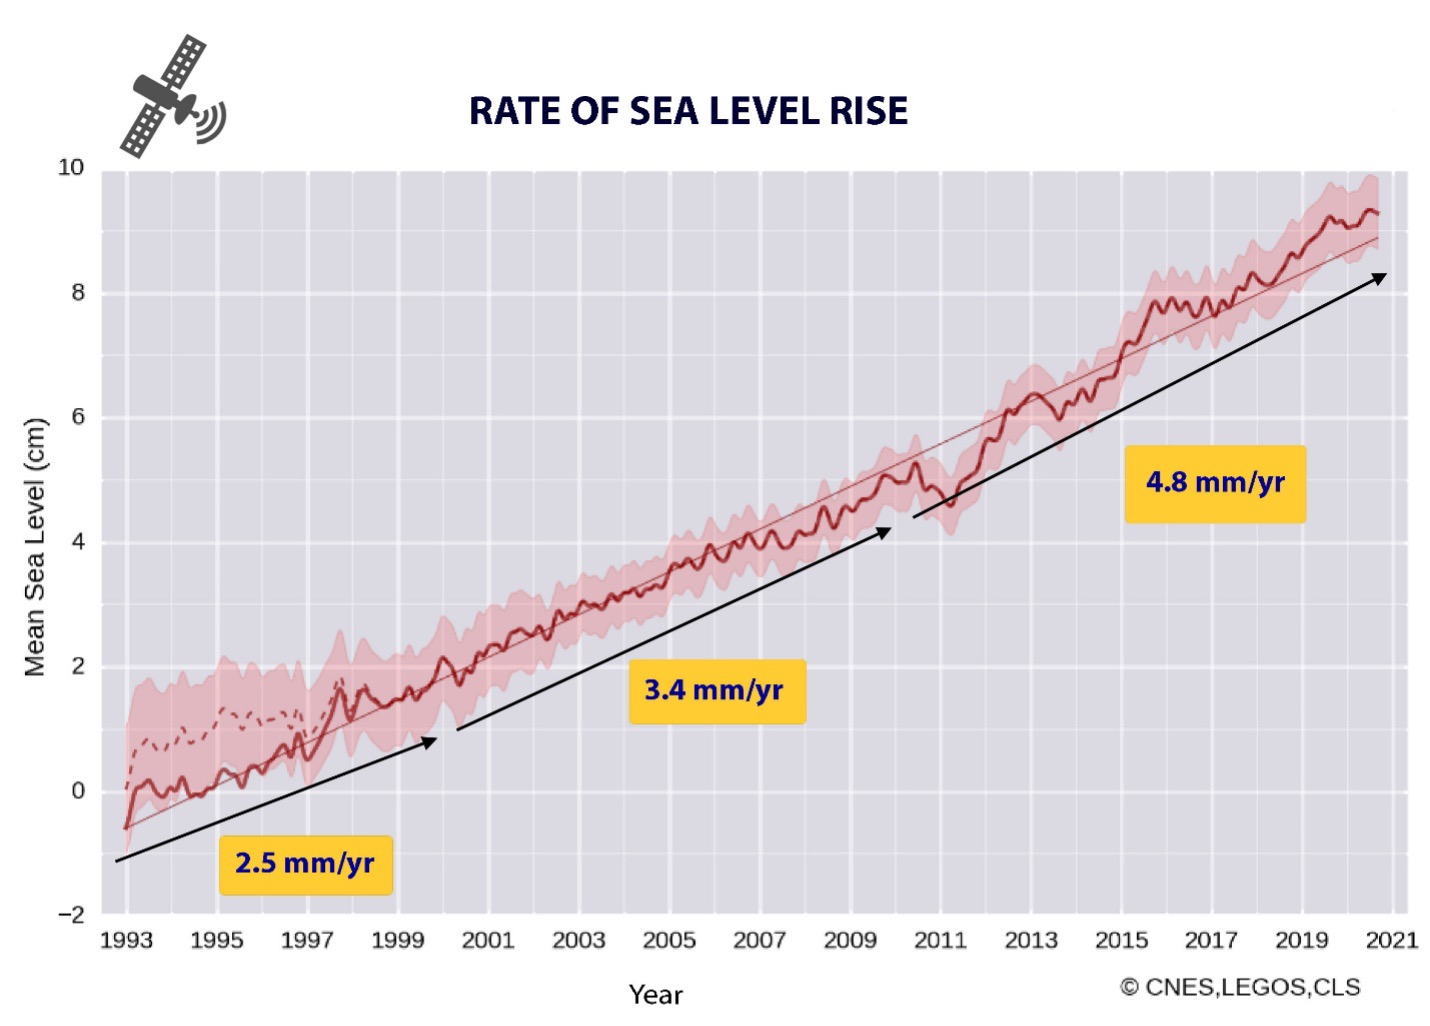
This graph shows the rate of sea level rise since 1993, when satellite measurements began. The rate has been accelerating every decade. It was rising at 2.5 mm per year in the 1990s, then 3.4 mm per year in the 2000s, and now sea level is currently rising at about 4.8 mm (~.25 inch) per year. That is exponential growth. If this trend continues, we could see 2-3 m (~5-10 ft) of sea level rise this century.